By Michael Ganslmeier (University of Exeter) and Tim Vlandas (University of Oxford). First posted at SPA blog
The growth of quantitative comparative social policy research
Since Wilensky’s seminal work in 1975, the comparative welfare state literature has seen hundreds of quantitative studies exploring why some countries have more generous welfare states than others. Over time, the list of proposed determinants has grown substantially: economic growth and development, partisanship and party politics, globalisation and migration, union strength and economic coordination, political institution and fiscal capacity, and public opinion; to name just a few.
As a result of this scholarship, our understanding of welfare state development has significantly improved. Yet, this expanding set of findings has not fully consolidated into a stable consensus about the determinants of welfare states, and less attention has been paid to comparing the robustness of different factors. The same variable has been shown to matter in one article and not in another, or even is sometimes found to have an opposite effect – see for example the debates on the role of globalisation.
Taking stock of discrepancies: the need for consolidation
Reasons for these discrepancies include conceptual and theoretical innovations, for instance around how to conceptualize and measure the welfare state, as well as new econometric techniques and the evolution of best practice, for example concerning the inclusion of country/time fixed effects or how to calculate standard errors. Other reasons include more and better data as well as the incentive structure of academic publishing to identify ‘new’ factors and the related difficulties of publishing null findings.
However, another often overlooked reason lies in the empirical choices that we all, as researchers across the social sciences, have to make to test the effects of new and existing factors: our decisions about which countries and years to include, how to define outcomes like welfare state generosity, which estimation strategies to employ, whether to include fixed effects, and/or how to treat standard errors. While the methodological best practice has evolved to require more robustness checks, most standard treatments only carry out a subset of possible robustness checks, often in isolation from one another, and without subjecting each variable to the same variation in specifications.
A new approach to estimating the extent and sources of sensitivity
In our recent article published in Proceedings of the National Academy of Sciences of the United States of America (PNAS), we ask how stable are the empirical findings about which factors matter for welfare state generosity? We combine the insights and strengths of the Extreme Bounds Analysis (EBA) and the multiverse approaches to systematically assess the sensitivity of results to a broad range of defensible modelling choices:
Dependent Variables: we used six different outcome measures for welfare state generosity: total social expenditure as a percentage of GDP, social transfers as a percentage of GDP, and an index of welfare state entitlement. For each of these indicators, we ran the sensitivity analysis in levels as well as first differences, resulting in six different outcome measures.
Independent Variables: we selected the following independent variables based on an in-depth literature review: an index of corporatism, crisis dummy, public debt, index of disproportionality, share of elderly, membership of the European Monetary Union, employment protection legislation, GDP per capita, centrist cabinet posts, centrist parliamentarians, left-wing cabinet posts, left-wing parliamentarians, industrial employment, capital account openness, trade openness, constitutional structure, union density, and unemployment rate. This resulted in 262,143 combinations of potential control sets, i.e. which variables are included in any given regression.
Sample of countries: we then run our analyses on seven country sub-samples based on the following regime classification: Anglo-Saxon, Bismarckian, Scandinavian, Southern European, South-Eastern European, all countries without South-Eastern European regimes; and a sample with all countries included.
Time period: next, we further rerun our analysis for three different time periods: 1980–2000, 2000–2016, and the entire time period (1980–2016).
Fixed Effect Structures: we applied four different fixed effect combinations: year fixed effects only, country fixed effects only, both country and year fixed effects, and no fixed effects.
Standard Error Types: we used three types of standard errors: simple/unadjusted, heteroscedasticity-robust, and Huber-White clustered at the country level.
How robust are the findings?
Running all possible combinations of the aforementioned modelling choices resulted in over 3.5 billion regression coefficients. This made it possible to create a high-dimensional modelling space that systematically varied the sample composition, outcome definitions, control variables, fixed effects, estimation techniques, and clustering methods.
Our analysis of the factors associated with welfare generosity revealed a striking pattern. For many variables commonly cited in the literature—such as left-wing party power, union density, or globalisation—we found an immense number of specifications where the coefficient was statistically significant and positive, where it was not significant at all, and others where it was statistically significant and negative (Figure 1). Crucially, all of these outcomes emerged from combinations of reasonable, widely used modelling decisions, and we also rerun our analysis for a subset excluding specifications that suffered from multicollinearity or omitted variable bias.
Figure 1: Significance shares for the effect of different independent variables on public social spending
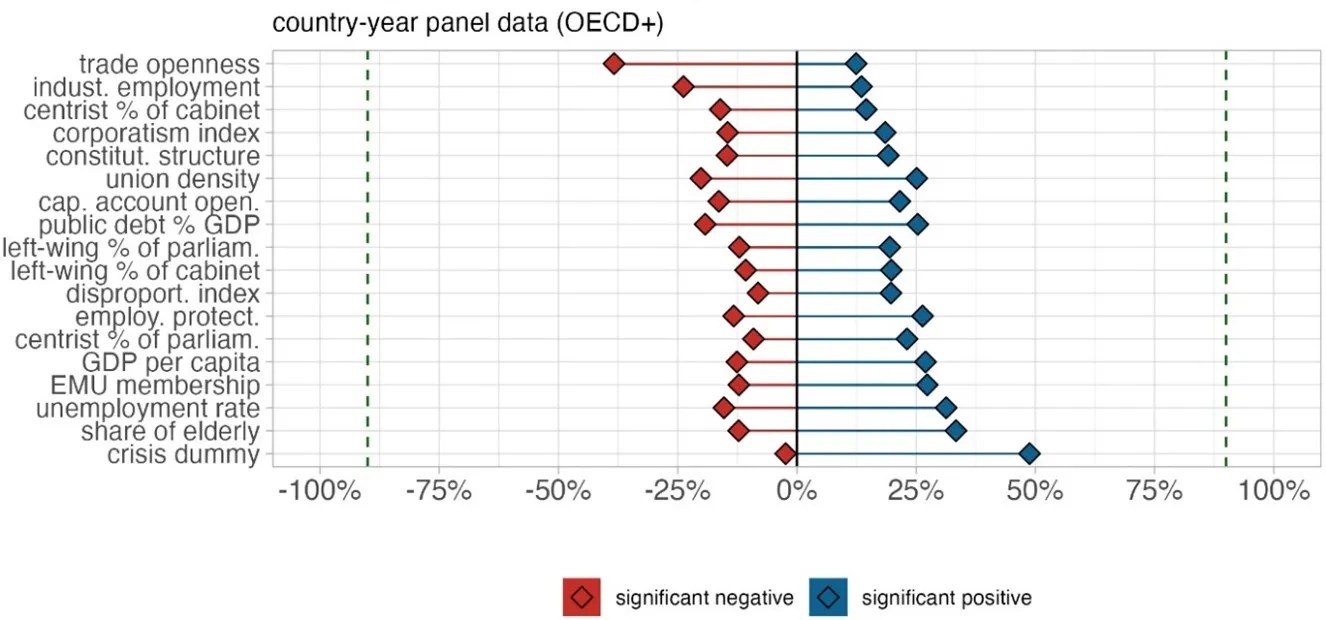
Notes: The figure plots the share of positive (blue) and negative (red) significant coefficients of all independent variables in the full model space. A coefficient is classified as “significant” if its p-value is below 0.1. The dashed line indicates 90%. This Figure is adapted from “Estimating the Extent and Sources of Model Uncertainty in Political Science,” Proceedings of the National Academy of Sciences (2025), available at https://www.pnas.org/doi/10.1073/pnas.2414926122.
The sources of sensitivity
Next, we identify which types of decisions were most consequential. Surprisingly, it was not the inclusion or exclusion of standard control variables that drove most of the variation. Instead, the most powerful determinants of fragility were sample construction—which countries and time periods were analysed—and outcome operationalisation, especially how generosity was measured (Figure 2), echoing a longstanding literature emphasising the importance of how the welfare state is conceptualised. These early modelling choices, often made before estimation begins, shaped the range and direction of estimated effects more than any individual covariate.
Figure 2. Drivers of fragility in significance of factors on welfare state generosity

Notes: Feature importance scores of model specification decisions. The panels show the feature importance scores (SHAP values) for different model specification choices. To estimate them, we extracted a random set of 250,000 regression coefficients from the unrestricted model universe for each test case. Then, we fit a multilayer neural network to predict whether an estimate is “negative significant,” “positive significant” or “not significant.” After employing a grid-search algorithm to define the most suitable hyperparameter structure, we use the best model with the highest classification accuracy to estimate the SHAP values of each model specification binary. This Figure is adapted from “Estimating the Extent and Sources of Model Uncertainty in Political Science,” Proceedings of the National Academy of Sciences (2025), available at https://www.pnas.org/doi/10.1073/pnas.2414926122.
Robustness in welfare state research
These findings do not imply that past research is flawed or unreliable. Instead, they highlight a challenge in cumulative empirical work in welfare state studies: when multiple plausible paths through the modelling space are available, even small choices can exert large influence on final results.
Conventional robustness checks tend to examine a handful of alternative specifications, often around a single baseline model. Our results suggest this approach may not be enough. What matters is not only whether individual modelling decisions affect the results, but how their combinations, sometimes dozens at once, can jointly determine the substantive conclusion.
Ways forward
Welfare state research has built an impressive set of concepts, theories, and empirical tests. By treating the model space as something to be explored systematically rather than held constant, we can make more transparent which results are robust across specifications and which are not.
Our approach is not a substitute for the crucial importance of theory or careful empirical specifications, but a way to also ground empirical claims in a more exhaustive and transparent understanding of their conditionality, one that complements existing empirical practices and strengthens the methodological toolkit for future work in comparative social policy.
Read the full study in PNAS and explore replication materials on Zenodo:
https://www.pnas.org/doi/10.1073/pnas.2414926122 | https://doi.org/10.5281/zenodo.15480536

You must be logged in to post a comment.